PTE Academic describe image with model answers exercise
PTE Academic describe image with model answers exercise. PTE Academic speaking describe image practice exercise.Look at the images below and describe in detail what the image is showing.You will have 25 seconds to describe image.
1.
Describe image model answer ( for practice purpose )
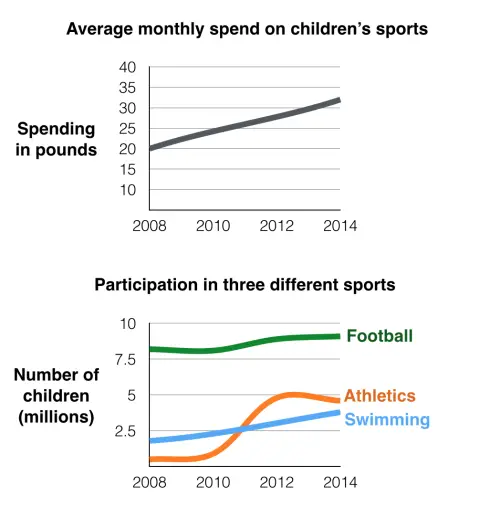
The line graphs shows the average monthly amount that parents in Britain spent on their children’s sporting activities and the number of British children who took part in three different sports from 2008 to 2014.
It is clear that parents spent more money each year on their children’s participation in sports over the six-year period. In terms of the number of children taking part, football was significantly more popular than athletics and swimming.
In 2008, British parents spent an average of around £20 per month on their children’s sporting activities. Parents’ spending on children’s sports increased gradually over the following six years, and by 2014 the average monthly amount had risen to just over £30.
Looking at participation numbers, in 2008 approximately 8 million British children played football, while only 2 million children were enrolled in swimming clubs and less than 1 million practised athletics. The figures for football participation remained relatively stable over the following 6 years. By contrast, participation in swimming almost doubled, to nearly 4 million children, and there was a near five fold increase in the number of children doing athletics.
Click here for : PTE reading fill in the blanks practice exercise
2.