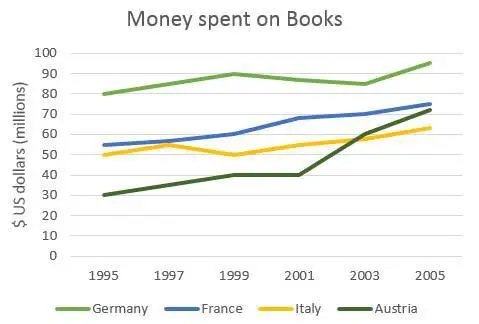
PTE Academic Speaking describe image
Describe image sample response
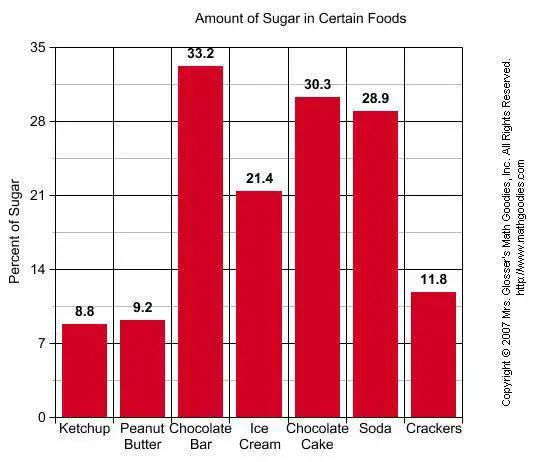
The bar graph illustrates the levels of sugars in seven various types of foods. It is immediately apparent that the chocolate bar contains maximum levels of sugars, while ketchup accounted for the least
To begin, just over one third of sugar is present in chocolate bar, closely followed by chocolate cake and soda at just over and just under a third respectively. Approximately one fifth sugar is present in ice cream, while crackers contain only approximately one out of ten. Finally, the sugar levels in ketchup and butter accounts for in the range of nearly 9%
PTE Academic Speaking describe image