PTE speaking describe image model answer
Look at the images below and describe in detail what the image is showing.You will have 25 seconds to describe image.Model answers are given for practice purpose only.
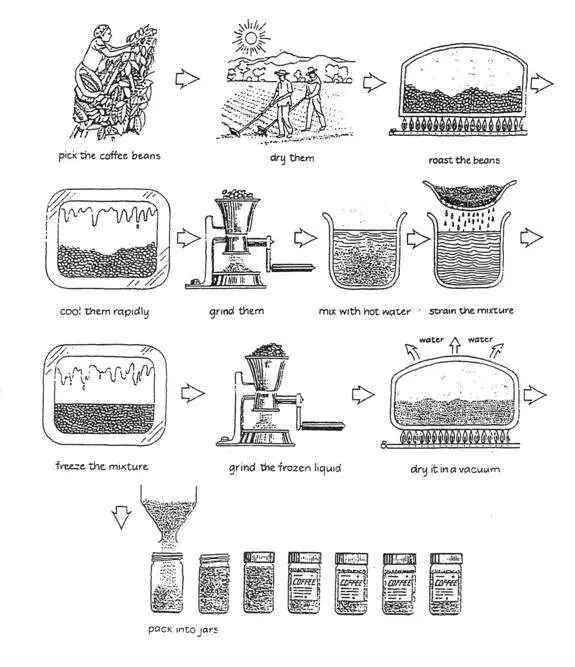
1.
PTE speaking describe image model answer
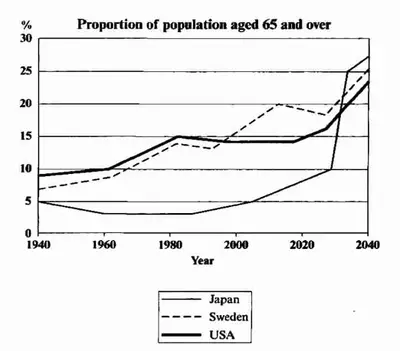
The line graph compares the percentage of people aged 65 or more in three countries over a period of 100 years.
In 1940, around 9% of Americans were aged 65 or over, compared to about 7% of Swedish people and 5% of Japanese people. The proportions of elderly people in the USA and Sweden rose gradually over the next 50 years, reaching just under 15% in 1990. By contrast, the figures for Japan remained below 5% until the early 2000s.
Looking into the future, a sudden increase in the percentage of elderly people is predicted for Japan, with a jump of over 15% in just 10 years from 2030 to 2040. By 2040, it is thought that around 27% of the Japanese population will be 65 years old or more, while the figures for Sweden and the USA will be slightly lower, at about 25% and 23% respectively.
Related Link:
PTE speaking describe image tips
2.