PTE speaking sample papers-describe images with answers
Look at the images below and describe in detail what the image is showing.You will have 25 seconds to describe image.Model answers are given for practice purpose only.
1.
Model Answer
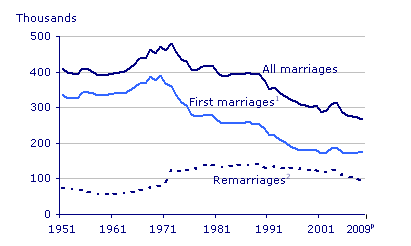
The line graph shows information about the number of all marriages, first wedding together with a number of remarriages that took place in the UK over the period of 1951 to 2009.Initially, a gradual increase could be very well observed in all marriages and first weddings followed by a fall in the later period. However, remarriages plummeted to a certain period with a steady increase in subsequent years.
In the year 1951, in spite of sharp fluctuations, the number of all weddings and first marriages were approximately 400,000 which soared to a new peak in the year 1971 reaching approximately 500,000 but these figures fell dramatically in 1973 and number of marriages dipped several times before sinking to a new low at the end of 2009.
The number of second marriages in 1951 were recorded just under 100,000.After 1971, a steady increase could be analyzed in number of remarriages reaching more than 100,000 but it fell below 100,000 in 2009.
RELATED LINKS:
PTE Academic speaking describe image test tips
MORE PTE SPEAKING DESCRIBE IMAGE SAMPLES WITH ANSWERS
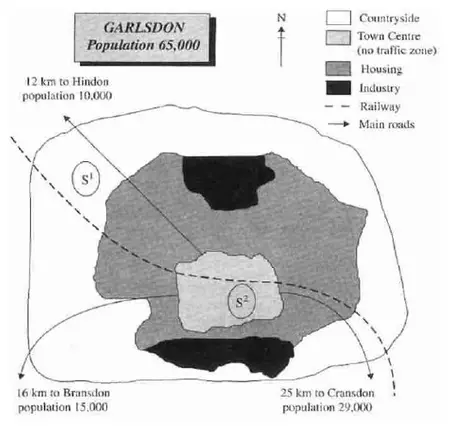
2.
The map below is of the town of Garlsdon. A new supermarket (S) is planned for the town. The map shows two possible sites for the supermarket.