PTE Academic Speaking describe image practice
Describe image sample response
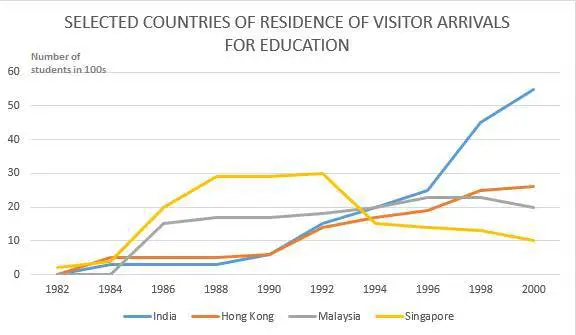
The depict line graph illustrates the relationship of Number of students which is in 100s with different years (from 1982 to 2000) of prominent Asian countries who visit for the purpose of education. To begin, dramatic increase is noticed on the Indian visitors while significant drop is noticed from the visitors of Singapore however Hong Kong and Malaysia are levelled off. Overall, Indian visitor showed substantial growth and Singapore dropped off drastically.
PTE Academic Speaking describe image model answers
Describe image sample response
The line graph illustrates the relationship of different age groups which is in percentage with the years during 1990 to 2010 of the attendees in the UK cinema. To begin, age between 14 to 34 rose sharply between the period of 2000 and 2010. However, dramatic increase is noticed between the age of 34 to 54 during the years 2000-05 and then levelled off. All in all, one can conclude that a substantial growth between 2000 and 2005 of different age groups
PTE Academic Speaking describe image practice answers
Describe image sample response
The given three pictures shows the considerable amount of development from 1962 to present day in Fontan and Meadowside village. As learnt, technology and globalization had played a vital role to connect either of them to other distant cities and also transformed them to business and urban estates comprising of Business park , leisure complex with hotel and station.
MORE PRACTICE LINKS:
PTE Academic speaking describe image tips for easy explanation
Latest PTE Essay Topics for PTE Academic writing
PTE Reading Tips- How Solve Fill in Blanks- get higher marks