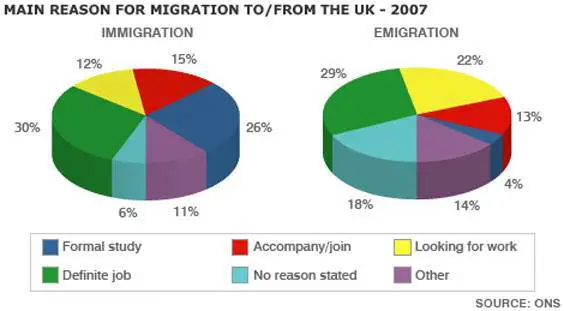
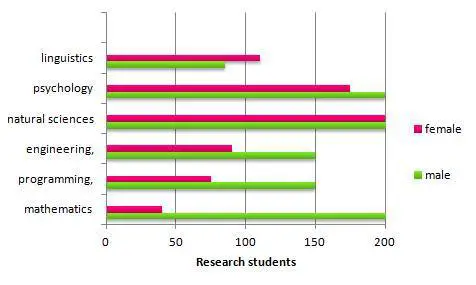
PTE Academic describe image with model answers
Describe image sample response
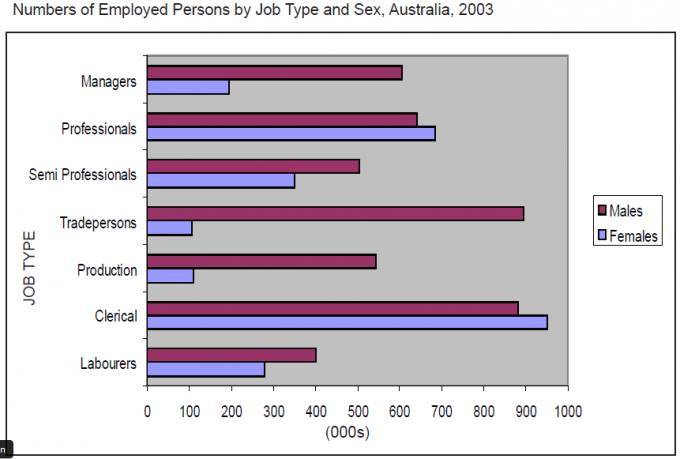
The bar chart illustrates the number of men and women employed in six positions in Australia in 2003. It is immediately evident that generally more number of males than females were employed, and that trade persons stood the highest for males and clerical for males over this time frame. To begin with males, around 900 worked in trade persons and clerical positions with approximately 600 worked in managers and professions. Finally, semi professionals, production and labourers positions stood in the range of between 400-500. Moving on to females the situation was totally different. 900 females worked in clerical positions, this figure was dropped to at least a half in professionals category, which was much more ahead of men. Next, semi professionals, labourers and managers positions for females were in the range of 200-300, but lesser than males. Finally, only one in ten women worked in trade persons and production.
PTE Academic describe image sample