PTE Academic speaking describe image sample answer
PTE Academic speaking describe image sample answer.Look at the images below and describe in detail what the image is showing.You will have 25 seconds to describe image.
1.
Describe image sample answer
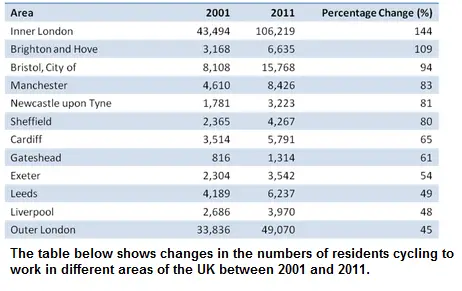
The table compares changes in the number of people who used bicycle for their transportation between 2001 and 2011.
It is clear that most Londoners both in outer and inner part of the city used a bicycle for their commuting and this trend for residents of the inner part had the highest growth over the 10-year period.
In 2001, inner London with 34.494 cyclers was at the top of the list followed by residents from outer London area with 33.868 bike commuters. Between all other cities in the table, Gateshead with only 816 was the city with the least interest for biking.
By 2011, the number of residents who ran to work by bicycle with 144% growth reached the peak of 106.219, in contrast with their neighbor in the outer part of the city who showed only 45% growth from 33.836 in 2001 to 49.070 in 2011. A dramatic change can be seen on the number of bikers who reside in Brighton and Hove. In these cities, the number of bike commuter from 3.168 in 2001 with 109% increase reached 6.635 in 2011.
RELATED LINKS:
PTE Academic speaking describe image tips for easy explanation
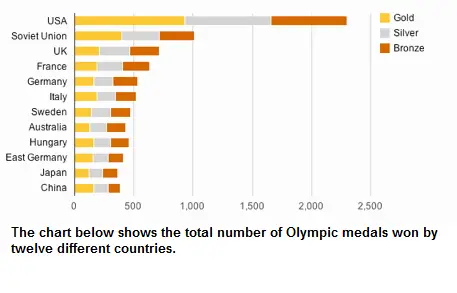
2.