PTE speaking practice exercise-describe image model answers
Look at the images below and describe in detail what the image is showing.You will have 25 seconds to describe image.Model answers are given for practice purpose only.
1.
Speaking describe image sample answer
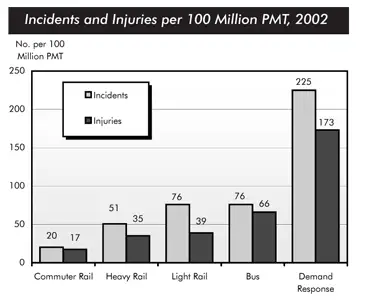
The bar chart compares the number of incidents and injuries for every 100 million passenger miles traveled on five different types of public transport in 2002.
It is clear that the most incidents and injuries took place on demand-response vehicles. By contrast, commuter rail services recorded by far the lowest figures.
A total of 225 incidents and 173 injuries, per 100 million passenger miles traveled, took place on demand-response transport services. These figures were nearly three times as high as those for the second highest category, bus services. There were 76 incidents and 66 people were injured on buses.
Rail services experienced fewer problems. The number of incidents on light rail trains equalled the figure recorded for buses, but there were significantly fewer injuries, at only 39. Heavy rail services saw lower numbers of such events than light rail services, but commuter rail passengers were even less likely to experience problems. In fact, only 20 incidents and 17 injuries occurred on commuter trains.
2.
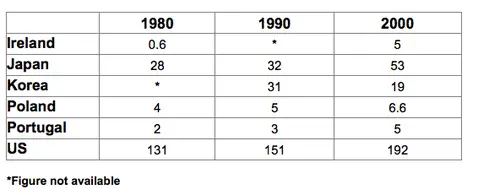
The table shows the amount of waste production (in millions of tonnes) in six different countries in three different years over a twenty-year period.
Sample Answer
The table compares the output of waste produced by six different countries in 1980, 1990 and 2000 respectively. The noticeable figure is that the US produced by far the most amount of waste in three different years. It can be clearly seen that the waste production rose in every country over the twenty year period apart from Korea.
In 1980, US produced 131 million tonnes of waste material while the figures for Japan stood at 28 million tonnes. No figures were therefore, recorded for Korea in 1980 but in 1990, 31 million tonnes were created in this country. By 2000, In US production of waste had risen to 192 million tonnes while Japan’s figures had risen to 53 million tonnes. However, Korea managed to reduce its output to 19 million tonnes.
Ireland, Poland and Portugal only produced a total of 30 million tonnes between them, adding the for all three years together.
Overall, figures for almost all of the countries contributing to the output of waste material had risen over the twenty year period.
PTE speaking practice exercise-describe image model answers