PTE speaking describe image answers
PTE speaking describe image answers.Look at the images below and describe in detail what the image is showing.You will have 25 seconds to describe image.Model answers are given for practice purpose only.
1.
Describe image answer
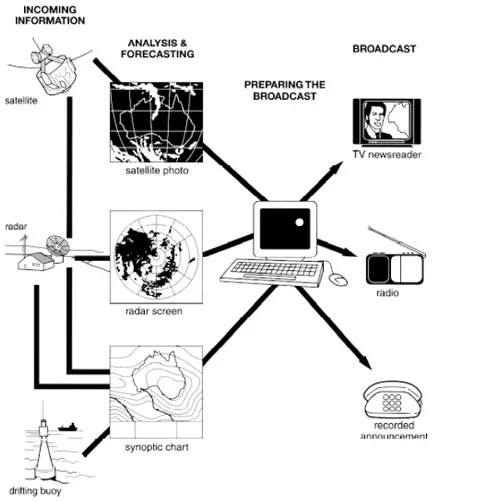
The chart describes the process of collecting data via different channels to ensure the reliability of weather report.
The whole process comprises of four stages, starting from the incoming sources of information. After an estimated outcome is generated, it will be entered and stored into a technological device such as computers. When it is well-prepared, it will be disseminated to the public.
To begin with, data is collected through satellite in the space, radar on the ground and drifting buoy in the sea. As long as this information is gained, a series of data processing will be followed such as analysis and forecasting. It is interpreted into visualised format including satellite photos, radar screen as well as a synoptic chart. The speculative result will be saved in the computer once the analysis is done, and be ready to broadcast. The public can get access to this information via different forms of media- TV newsreader, radio and recorded telephone.
Related Link:
PTE Academic speaking describe image tips for easy explanation
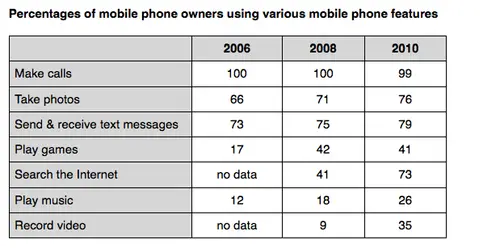
2.