Tag: describe image sample
PTE Academic speaking describe image sample 8 with answers
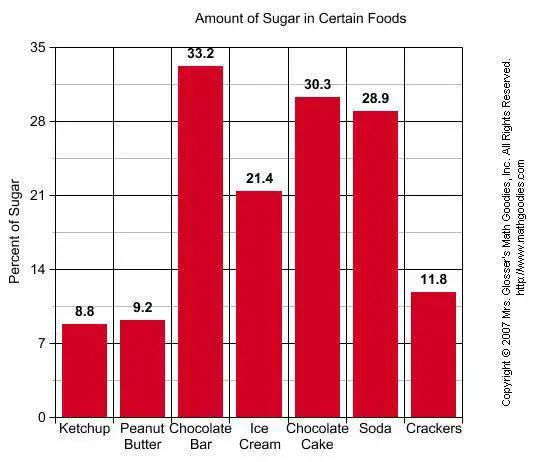
PTE Academic Speaking describe image Describe image sample response The bar graph illustrates the levels of sugars in seven various types of foods. It is immediately apparent that the chocolate bar contains maximum levels of sugars, while ketchup accounted for the least To begin, just over one third of sugar is present in chocolate bar, […]
PTE Academic speaking describe image practice sample 7
PTE Academic Speaking describe image practice Describe image sample response The depict line graph illustrates the relationship of Number of students which is in 100s with different years (from 1982 to 2000) of prominent Asian countries who visit for the purpose of education. To begin, dramatic increase is noticed on the Indian visitors while significant drop […]
PTE Academic speaking describe image sample 5
PTE Academic describe image with answers Describe image sample response The given bar graph illustrates the number of male and female users with certain age using internet browsers ie IE and Firefox.The top horizontal bar shows that out of 45 Firefox users and 54 IE users, female users are 22 years old and male users […]
PTE Academic speaking describe image sample 4
PTE Academic describe image Describe image sample response The line graph illustrates the share prices of Franklin in dollars for a period of 12 months in 2000. It is immediately evident that in January the share price was nearly $90 and reached a peak of around $150 in March. However, thereafter the share prices consistently […]