PTE Academic speaking describe image sample answer PTE Academic speaking describe image sample answer.Look at the images below and describe in detail what the image is showing.You will have 25 seconds to describe image. 1. Describe image sample answer The table compares changes in the number of people who used bicycle for their transportation between […]
Tag: describe image
PTE speaking describe image sample answer 17
PTE SPEAKING DESCRIBE IMAGE SAMPLE ANSWER PTE speaking describe image sample answer.Look at the images below and describe in detail what the image is showing.You will have 25 seconds to describe image. 1. Describe image sample answer The line graph compares levels of unemployment among 16 to 24-year-olds with overall unemployment figures over a period […]
PTE speaking describe image model answers 16
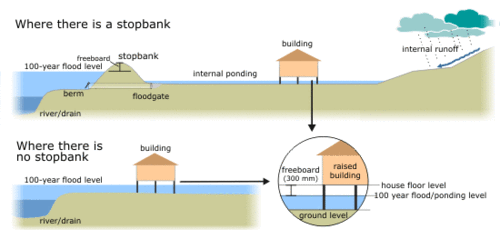
PTE speaking describe image model answers PTE speaking describe image model answers.Look at the images below and describe in detail what the image is showing.You will have 25 seconds to describe image. 1. Describe image sample answer The diagrams illustrate the modification of building a ground floor from an existing plan.It is noticeable that one […]
PTE Academic speaking describe image practice exercise 12
PTE Academic listening write from dictation practice sample 6
PTE Academic Listening write from dictation practice sample PTE Academic Listening write from dictation practice sample.In this section, you hear a sentence. You are then asked to write the sentence exactly as you heard it. You do 3-4 of these items, depending on the combination of items in your test.You can write on paper or […]
PTE Academic speaking describe image sample response 11
PTE Academic Speaking describe image sample Describe image sample response The line graph highlights the rate of smoking in Someland by both men and women over 40 years from 1960 to 2000. Male smokers were the highest in 1960 at 600 thousand and it gradually decline to a low of 300 thousand in 2000. On […]
PTE Academic speaking describe image sample response 9
PTE Academic Speaking describe image sample response Describe image sample response The line chart displays the purchased from Itunes, comparing the number of weeks to the songs purchased in millions. It had a steady growth from the first week to week 90 reaching 200 million purchases, each ,but from that point onwards it has taken […]
PTE Academic speaking describe image sample 8 with answers
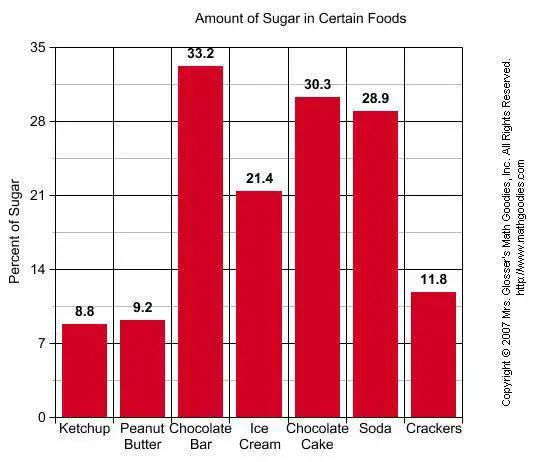
PTE Academic Speaking describe image Describe image sample response The bar graph illustrates the levels of sugars in seven various types of foods. It is immediately apparent that the chocolate bar contains maximum levels of sugars, while ketchup accounted for the least To begin, just over one third of sugar is present in chocolate bar, […]
PTE Academic describe image with model answers 6
PTE Academic describe image with model answers Describe image sample response The bar chart illustrates the number of men and women employed in six positions in Australia in 2003. It is immediately evident that generally more number of males than females were employed, and that trade persons stood the highest for males and clerical for […]
PTE Academic speaking describe image tips for easy explanation
PTE Describe image tips For people who are facing hard time in describe image Practice is the Key. For describing an image. You should memorize the start up words like: This graph shows —– This picture shows —- This image reflects —- Keep in mind you just have to tell the key points of the […]
PTE Academic speaking describe image sample 4
PTE Academic describe image Describe image sample response The line graph illustrates the share prices of Franklin in dollars for a period of 12 months in 2000. It is immediately evident that in January the share price was nearly $90 and reached a peak of around $150 in March. However, thereafter the share prices consistently […]
How to explain lengthy image graph in PTE Academic speaking
Describe image graph tips 1. This image graph item having second highest weight-age after re-tell lecture. So be focus on this, to achieve good scores in Speaking module. 2. There are 6 to 7 different types of things will get for this item type. Like, describe bar-graph, line-graph, pie-chart, block-diagram, table, photo, picture, to name […]
PTE Academic speaking describe image sample 2
PTE Academic describe image with answers Describe image sample responses 1.The graph explains the trend of UK visitors outbound and inbound to the UK from 1979 to 1999.As we see, the UK residents visit abroad was increased drastically from just over 10 million to around 50 million in these 20 years . And, at […]
PTE Academic describe image sample
PTE Academic describe image sample answers for practice Sample Describe image answers The presented graph illustrates the annual fluctuation in the IPP price of diesel in the two comparative years 2005 & 2006. Its evidential from the spikes that prices went up in May in 2005 and in June in 2006. The prices continued to […]

