PTE Academic describe image practice exercise-Images with answers
Sample response describe image
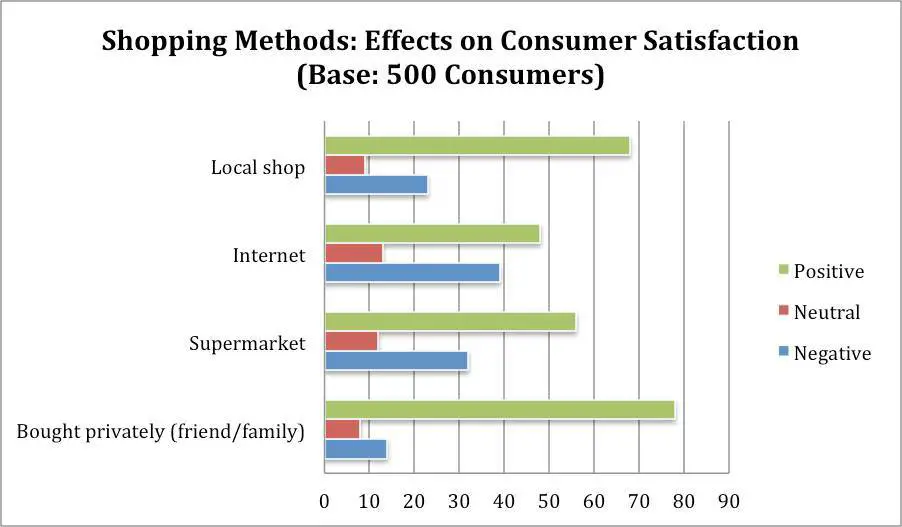
This horizontal bar graph depicts various shopping methods which are the effect of the satisfaction of consumers. The survey conducted with a customer base of 500. The vertical axis displays the different shopping methods like local shops, internet, supermarket, and private shopping used by consumers. As per records displayed, the percentage of neutral consumers is almost the same in all methods, where has the percentage of consumers who are positively affected are in private shopping methods.
Practice Links:
PTE describe image questions with sample answers | real exam questions
PTE Books-Buy these books for PTE Academic exam preparation
PTE exam questions from recent test-PTE exam memories

Sample response describe image
The flowchart illustrates the process of how a person could become a doctor. First, a person will have to complete a 4-year bachelor’s degree followed by four years in medical school. After which they will have to take part in an internship program for 3-7 years. After completing the internship program if a person doesn’t want to specialize they could direct sit for the licensing exam, but if they’re going to specialize they will have to complete a fellowship for 1-3 years and then take the licensing exams. The final step is to receive a medical license.
Describe image PTE response
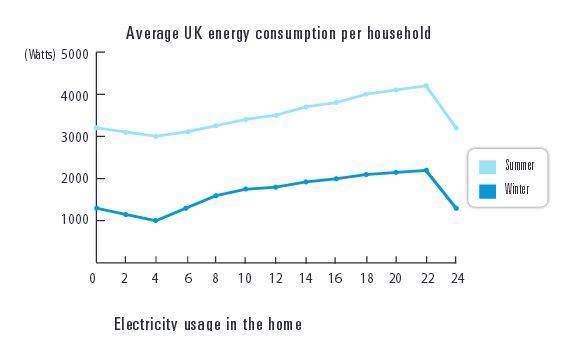
The line graph represents the average energy consumption per household in the UK. It can be seen that during the first 4 hours Britain consumed less amount of electricity in summer and winter. On the other hand, as time passed the electricity consumption rose gradually in both the seasons until during night they used less power. To sum up, the average consumption per household was the highest in summer and used less amount in winter.
Answer
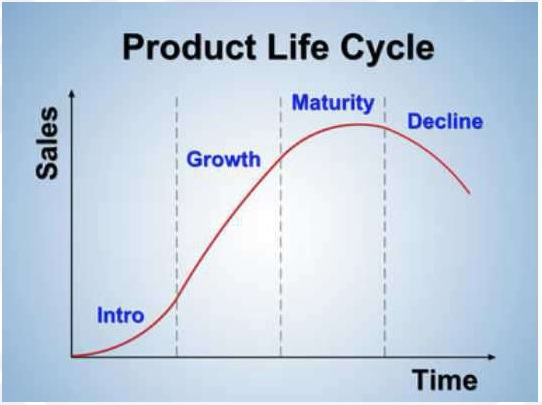
This line chart gives information about the product life cycle, in which sales vary in different periods of
time. There are four phases in the line chart, which are intro, growth, maturity, and decline. In the intro,
sales rise from zero, followed by growth, in which sales keep rising. In maturity, sales reach the highest
point, and then in decline, sales begin to drop gradually. In conclusion, this line chart gives very
thorough information about the product life cycle.
Answer
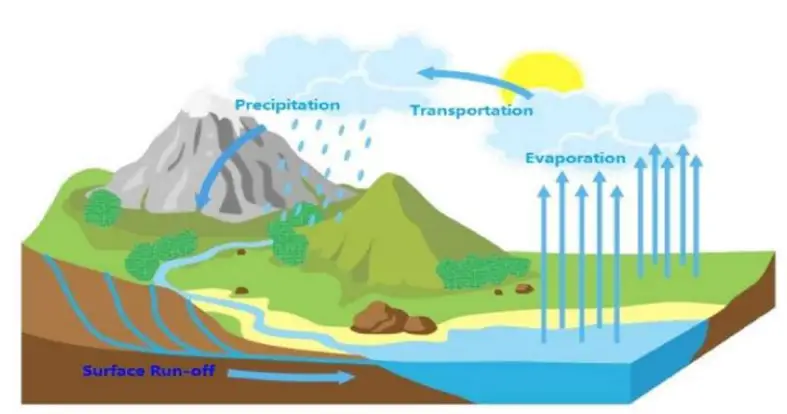
The following graph gives information about the water cycle in nature. It shows how the process is done.
The steps include evaporation, transportation, precipitation, and surface run-off. According to this
graph, the first step is evaporation in the sun, with water forming clouds into the sky from the blue
sea. The second step is cloud transportation into the sky above green and grey mountains, followed
by the third step of precipitation, in which water forms surface run-offs. The final step is surface runoffs going to the sea. In conclusion, this graph is very informative.
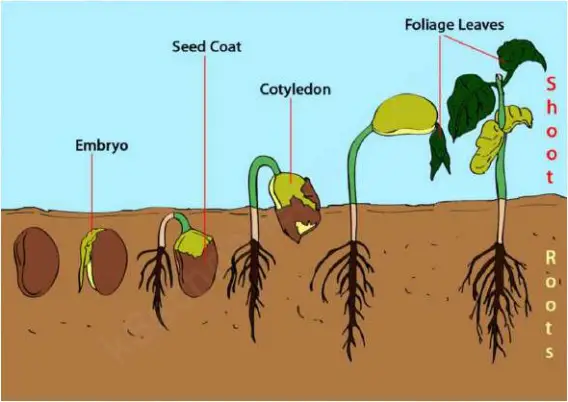
This picture gives information about the process of germination. In the first step, a seed is buried in
the soil, before it develops its green embryo in the second step. In the third step, the seed coat begins
to peel off and the black root begins to grow. After that, the light green cotyledon can be seen and
the seed rises from the soil. Finally, the dark green foliage leaves grow. In conclusion, this picture tells
how a seed grows.
More Describe images exercises:
PTE Academic speaking describe image practice exercise 12
PTE speaking describe images with answers 23
PTE PRACTICE LINKS:
PTE essay template and structure-Tips for PTE essay writing
New answer short questions from recent exams (updated)